“The first rule of any technology used in a business is that automation applied to an efficient operation will magnify the efficiency. The second is that automation applied to an inefficient operation will magnify the inefficiency”
Bill Gates
What the solution looks like
Below some visual examples of the interface using a Purchase to Pay (P2P) business case.
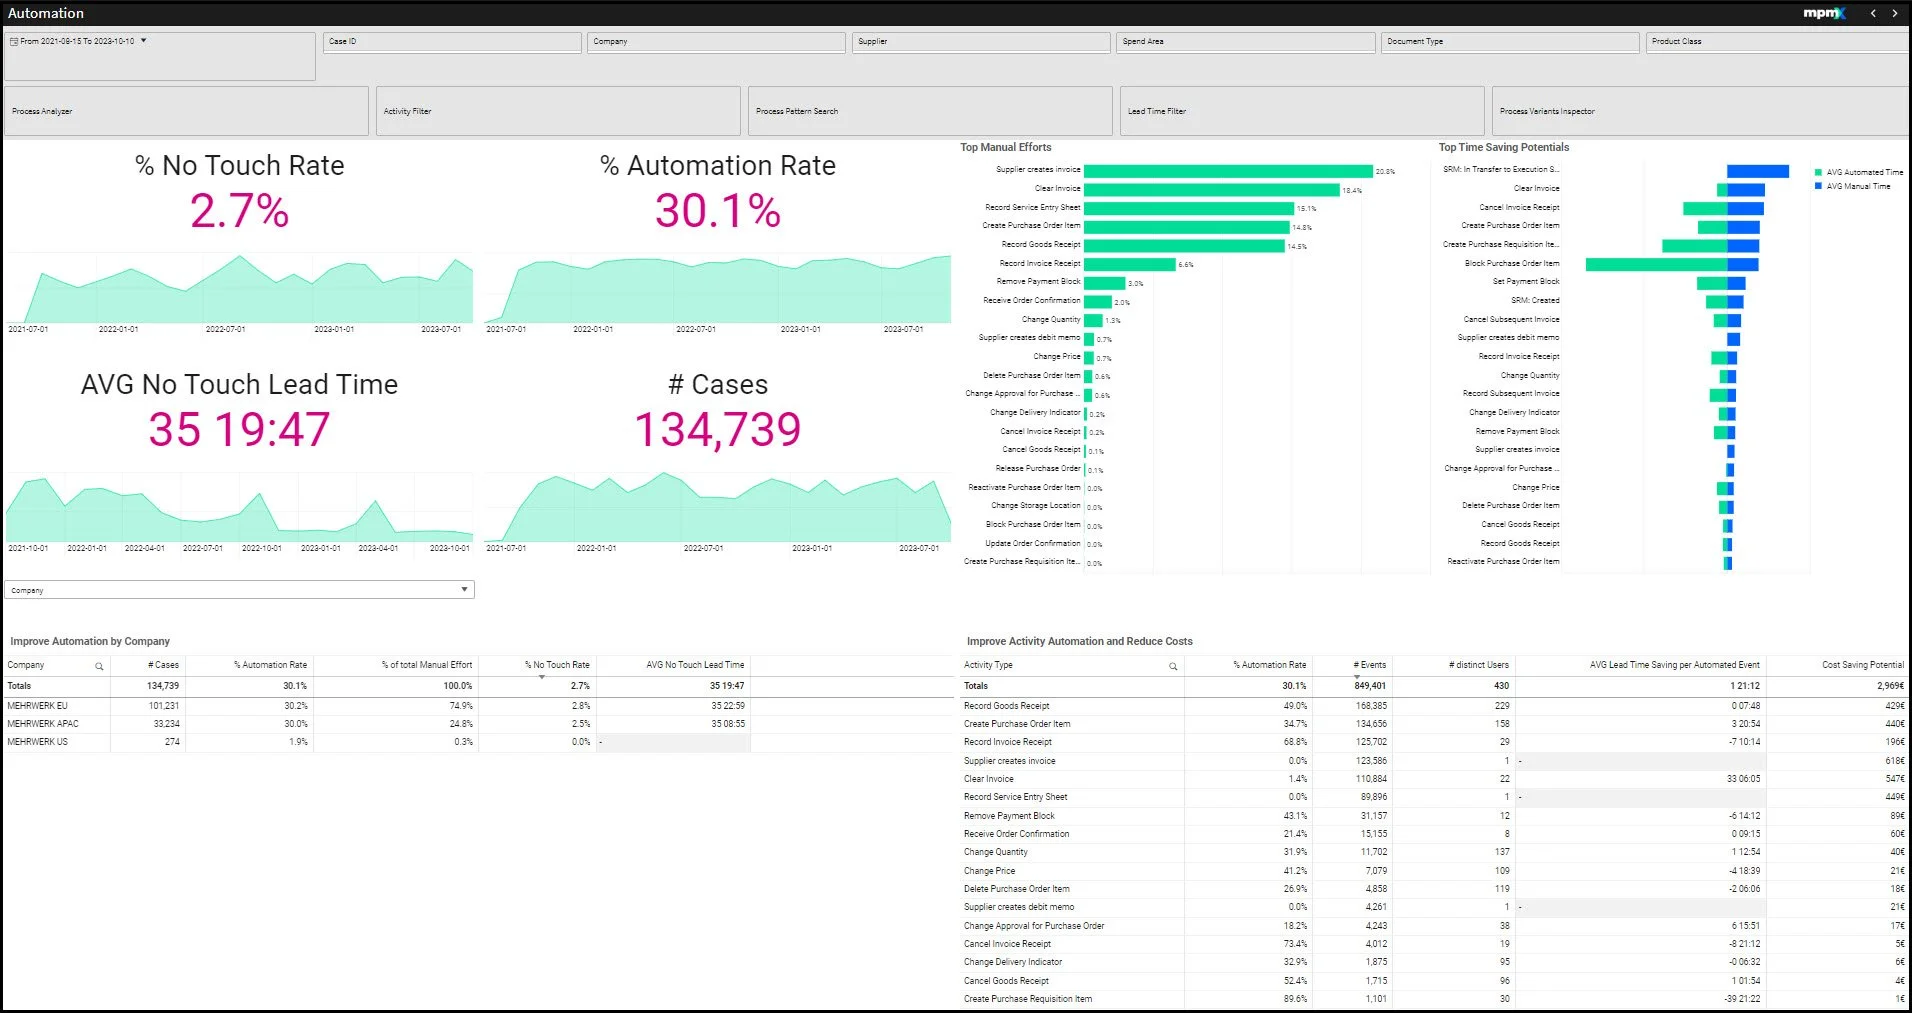
Optimization Dashboard
Functions:
• Analyze process performance indicators related to automation such as automation rates, no touch (completed automated) rates, and the lead time of no touch processes
• Detect and Analyze process steps that generate the most manual efforts
• Flexible Analysis by any given process context to validate most effective automation measures
Business Benefits
Management view to quickly identify optimization & saving potentials
Check on trends in the process to intervene quickly on dropping process performance indicators

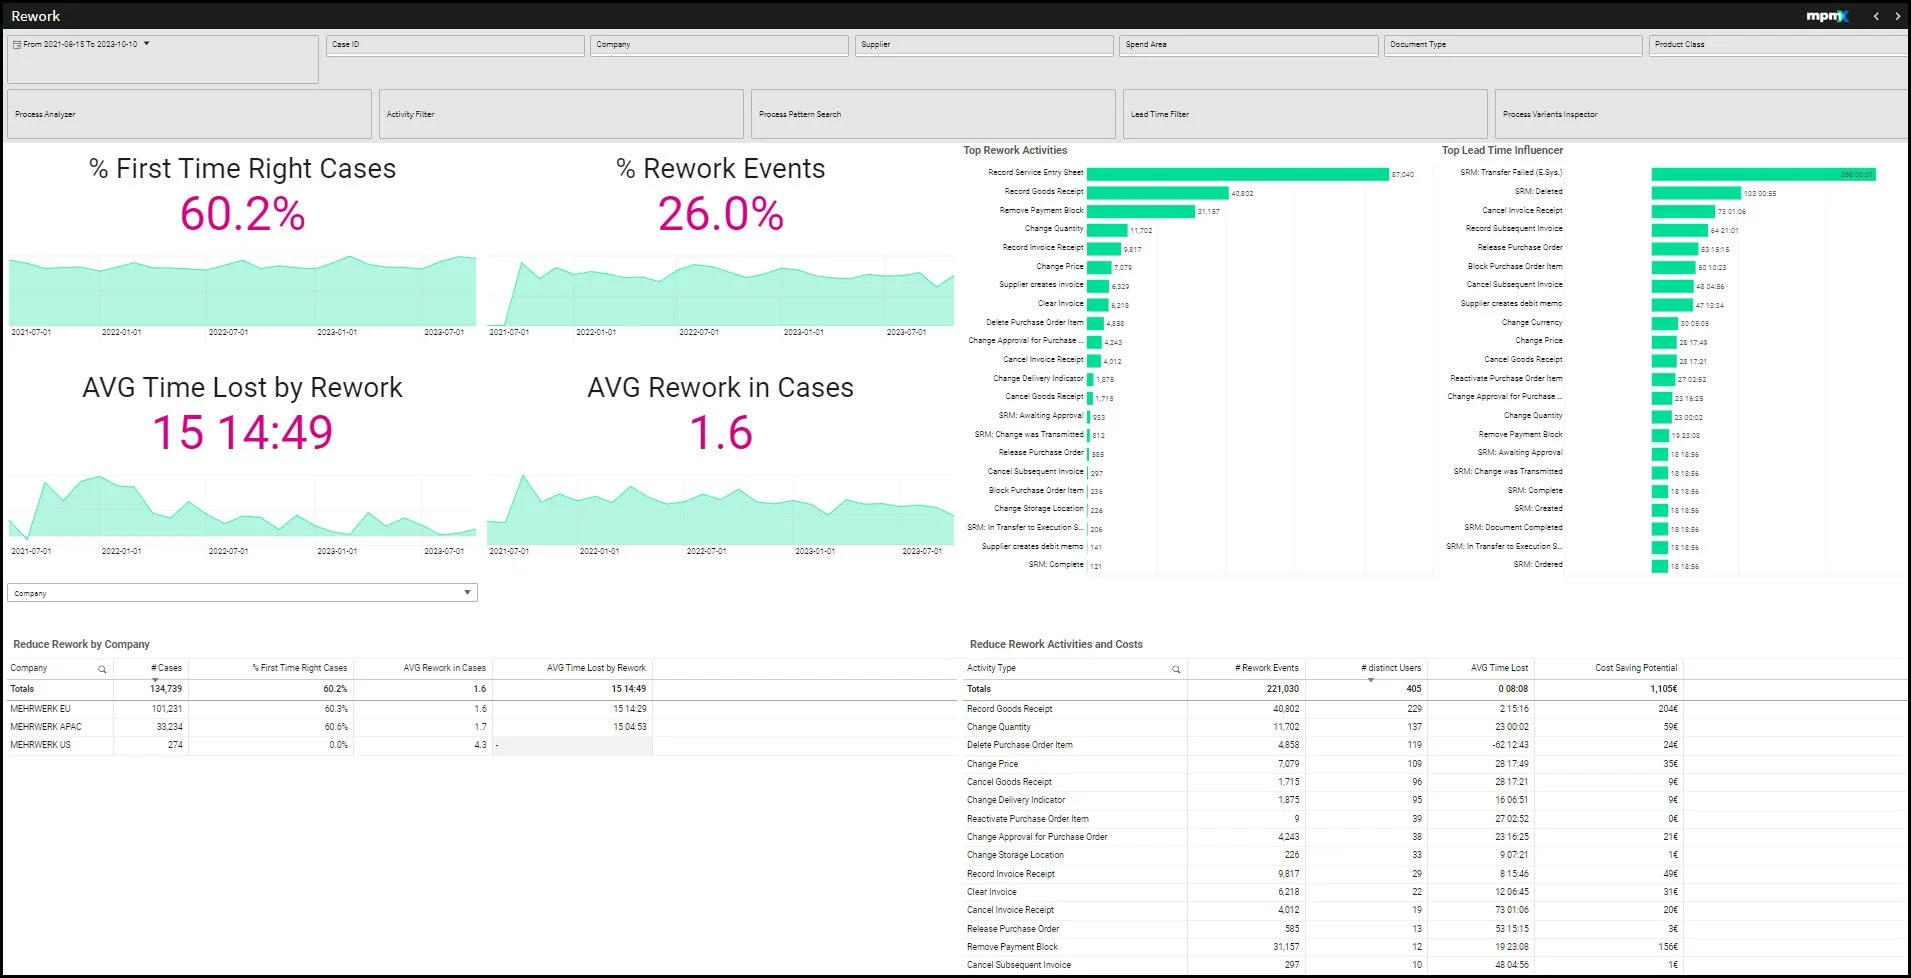
Rework Sheet:
Functions:
Analyze process performance indicators related to rework such as rework rates, cases without rework or the time lost due to rework
Detect and quantify the most common reworks and their impact on the lead time
Flexible Analysis by any given process context to validate most effective rework-reduction measures
Functions:
Compare a process model with the as-is process
Quantify deviations with the process performance indicators, like process conformance or perfect conformance
Identify and monitor the unnecessary or skipped process steps
Identify critical process deviations
Flexible analysis of any given process context to validate the most effective standardization measures
GINQO now offers a powerful process mining and automation platform designed to help businesses optimize and manage their workflows using advanced analytics, real-time insights, and automation tools. Discover how this technology can drive greater operational efficiency and foster sustainable improvements in your processes.
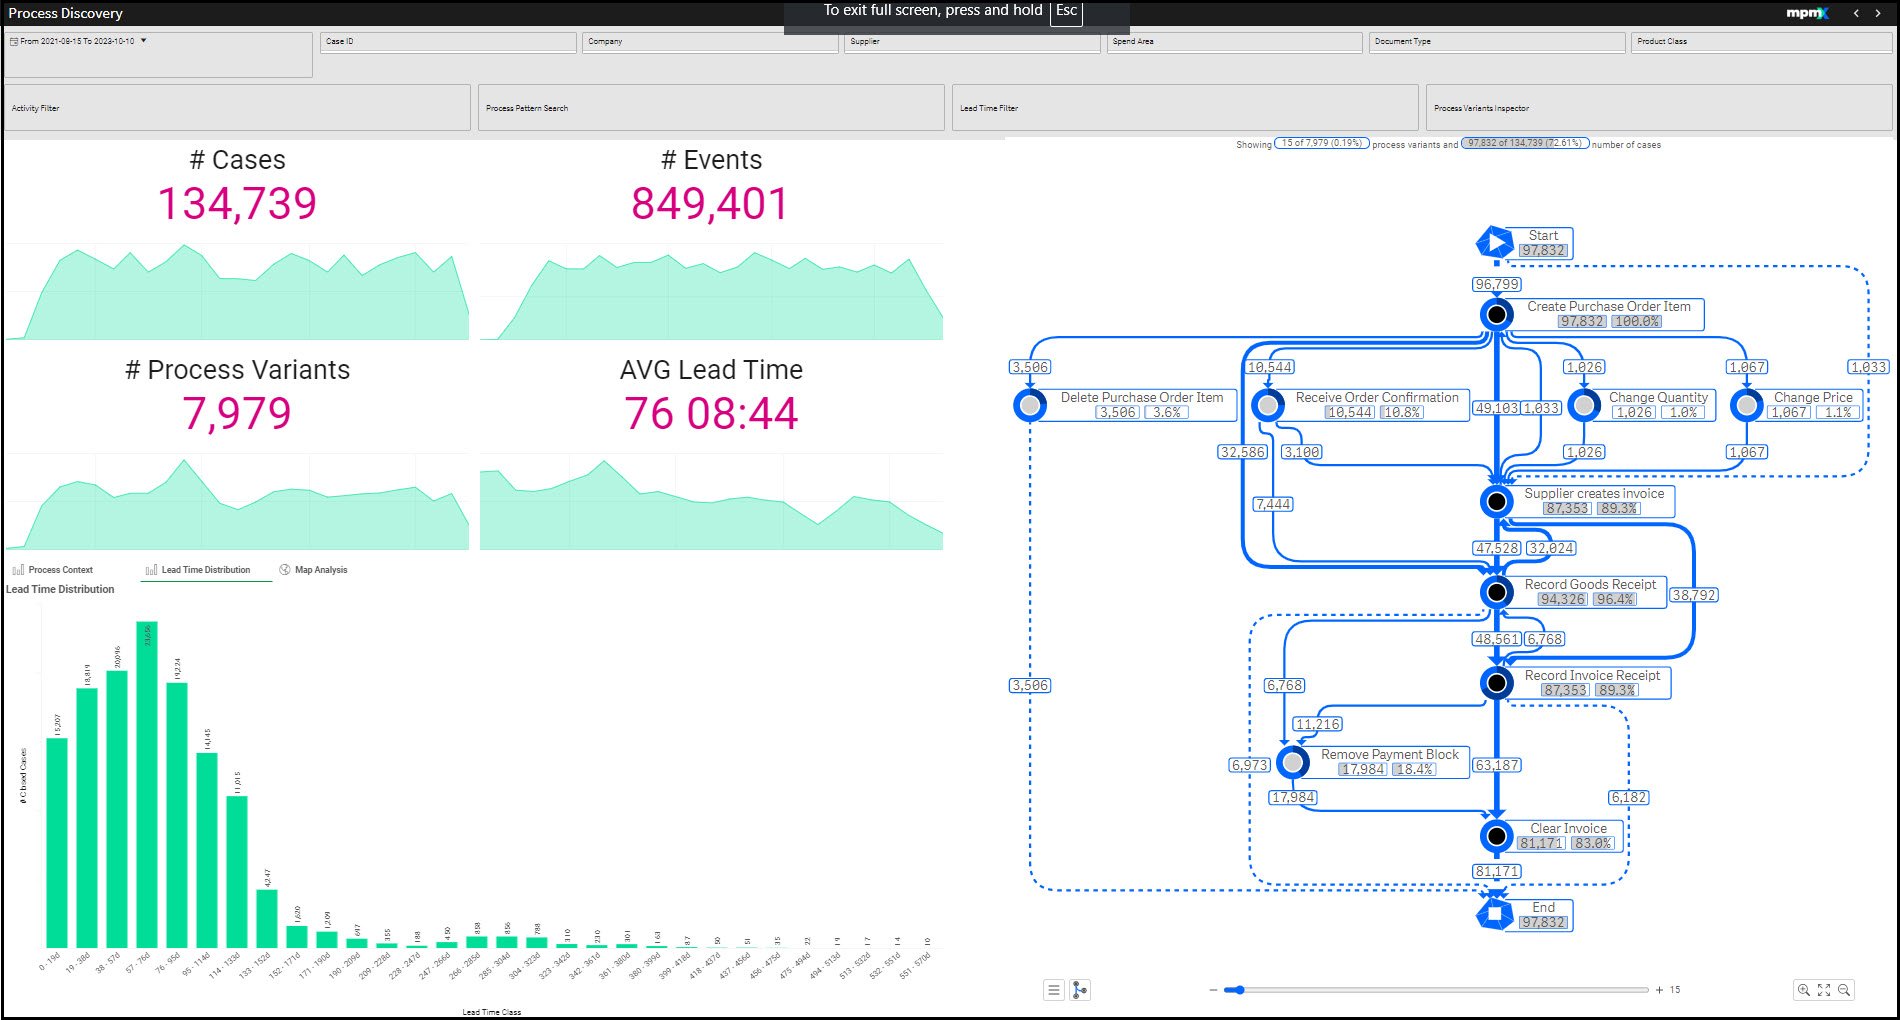
Process Discovery
Business Benefits
Impartial tool sheet for undirected process analysis
Supports basic process discovery and insights to the data
Business Benefits
Overview and monitor the current lead time level
Rapid analysis of (late) time drivers to derive corrective actions
Reduction and standardization of lead times for the overall process and defined sub-processes
2. Process Efficiency
Business Benefits:
• Overview on and monitoring of the current automation level
• Detect process steps that save the most resources when automated
• Calculate potential automation savings
• Priority-based decision-making for digitization measures
Business Benefits:
Overview and monitoring of the current automation level
Detect process steps that save the most resources when automated
Calculation of potential rework avoidance savings
3. Process Complexity
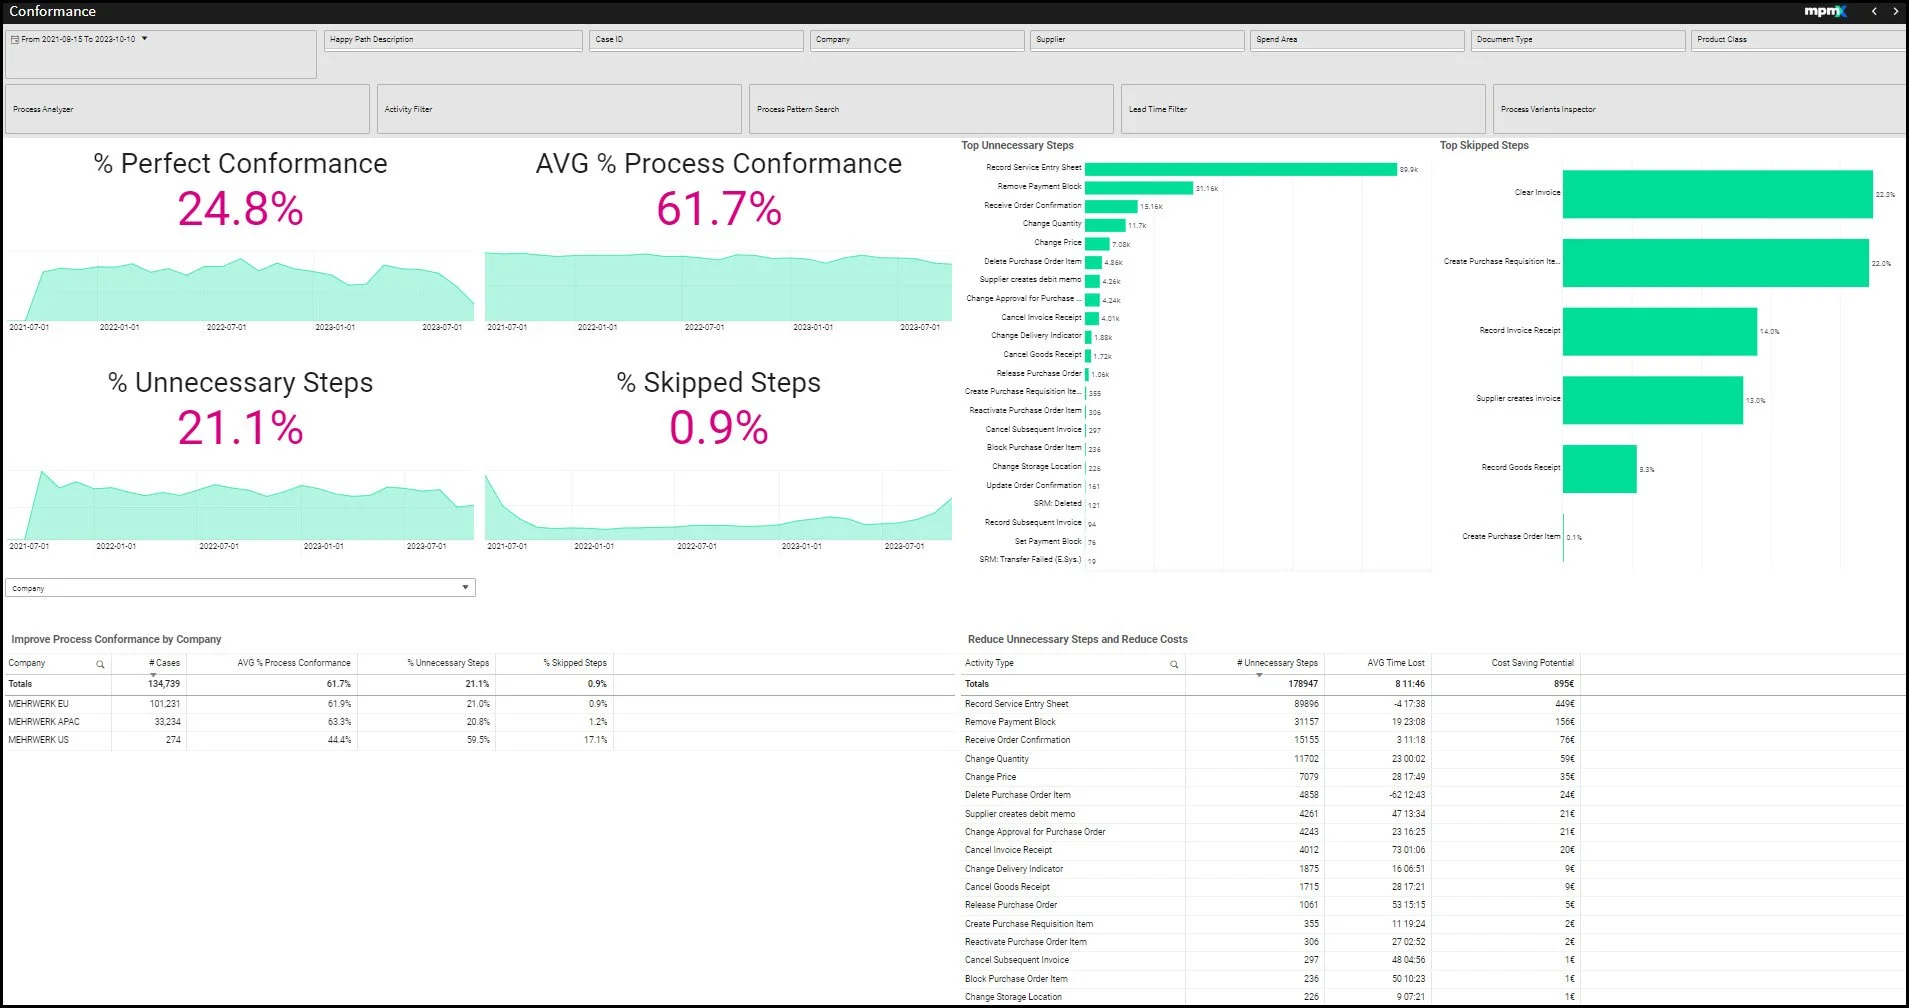
Conformance Sheet:
Business Benefits:
Overview and monitoring of the current process conformance level
Reduction of critical process deviations
Harmonization and standardization of processes
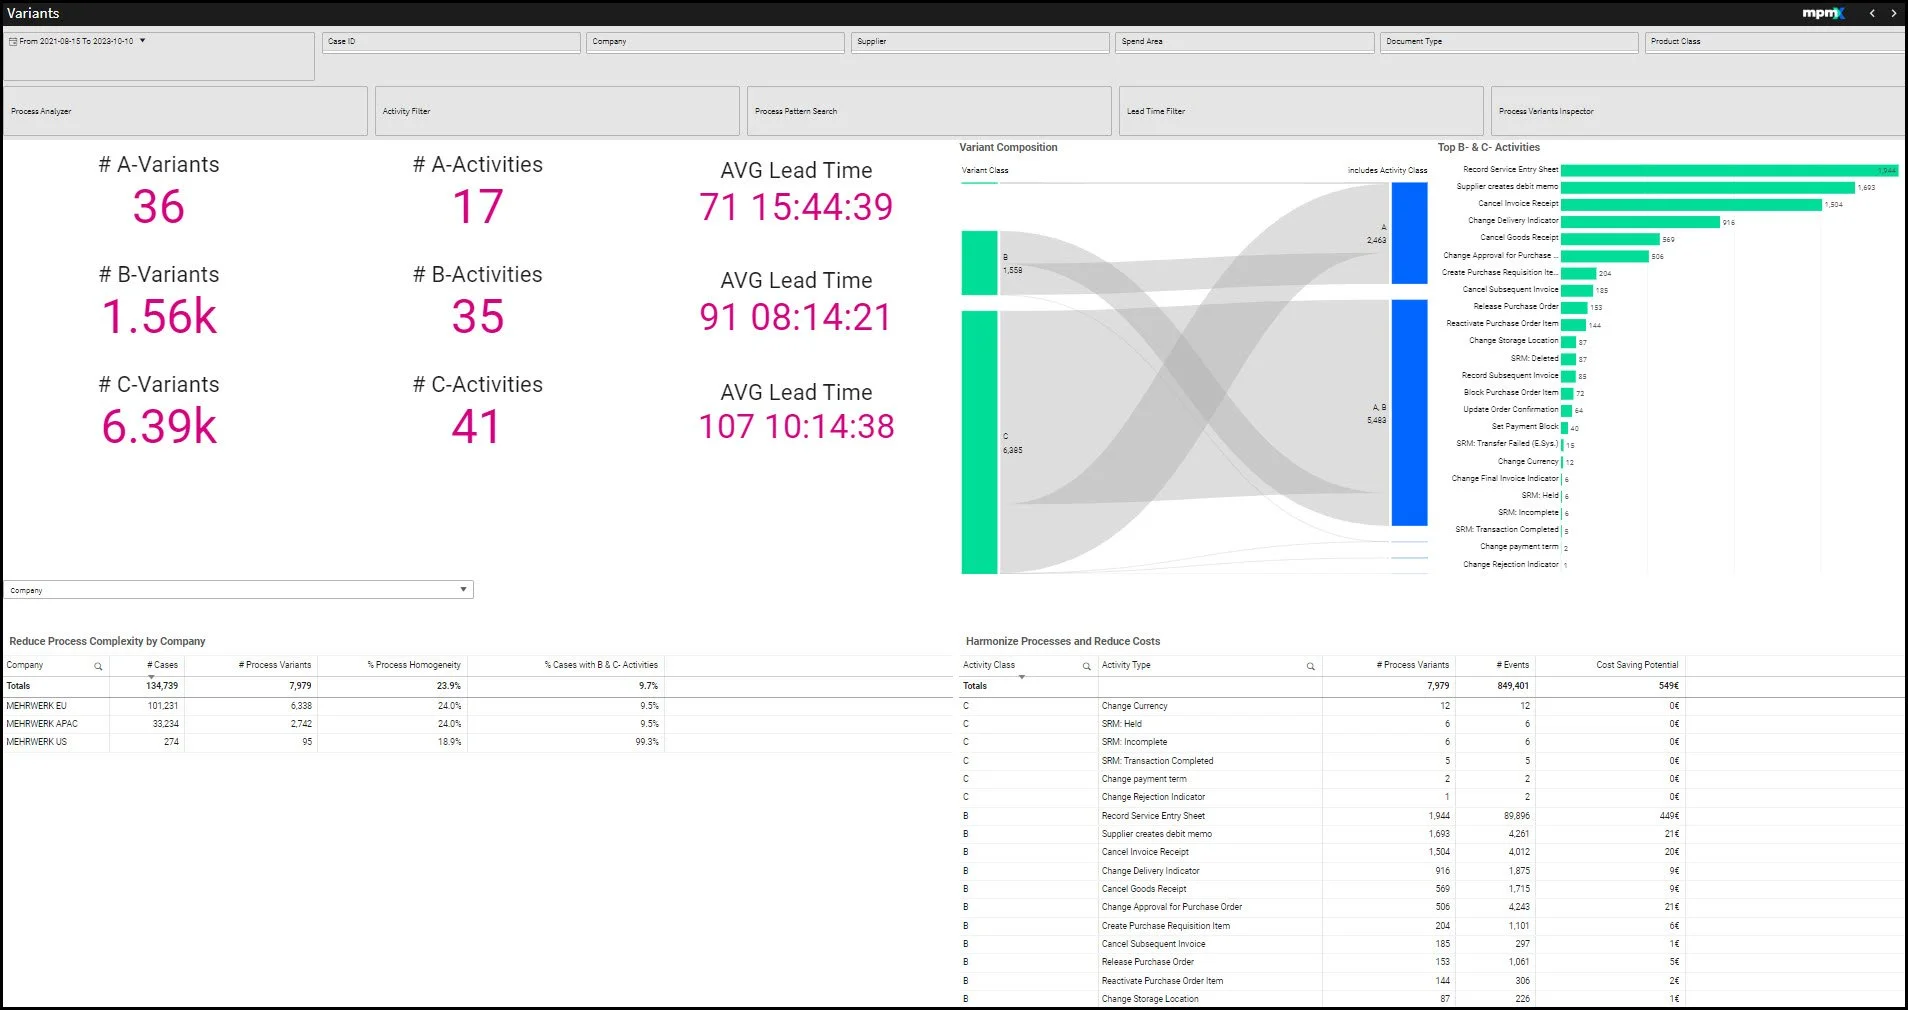
Variants Sheet:
Functions:
ABC Analysis of process variants
Quantify process complexity and its necessity
Categorize activities into A, B and C classes regarding their "first occurrence" process variant
Identify and separate core (A) and noncore (B & C) process steps
Analyze variant composition to derive harmonization measures
Flexible Analysis by any given process context to validate most effective automation measures
Functions
See all three areas of optimization at one glance: Effectiveness, Efficiency, and Complexity
Period comparison to see trend for important process performance indicators
Saving potentials calculation per optimization area based on cost, number and improvement potential per event
1. Process Effectiveness
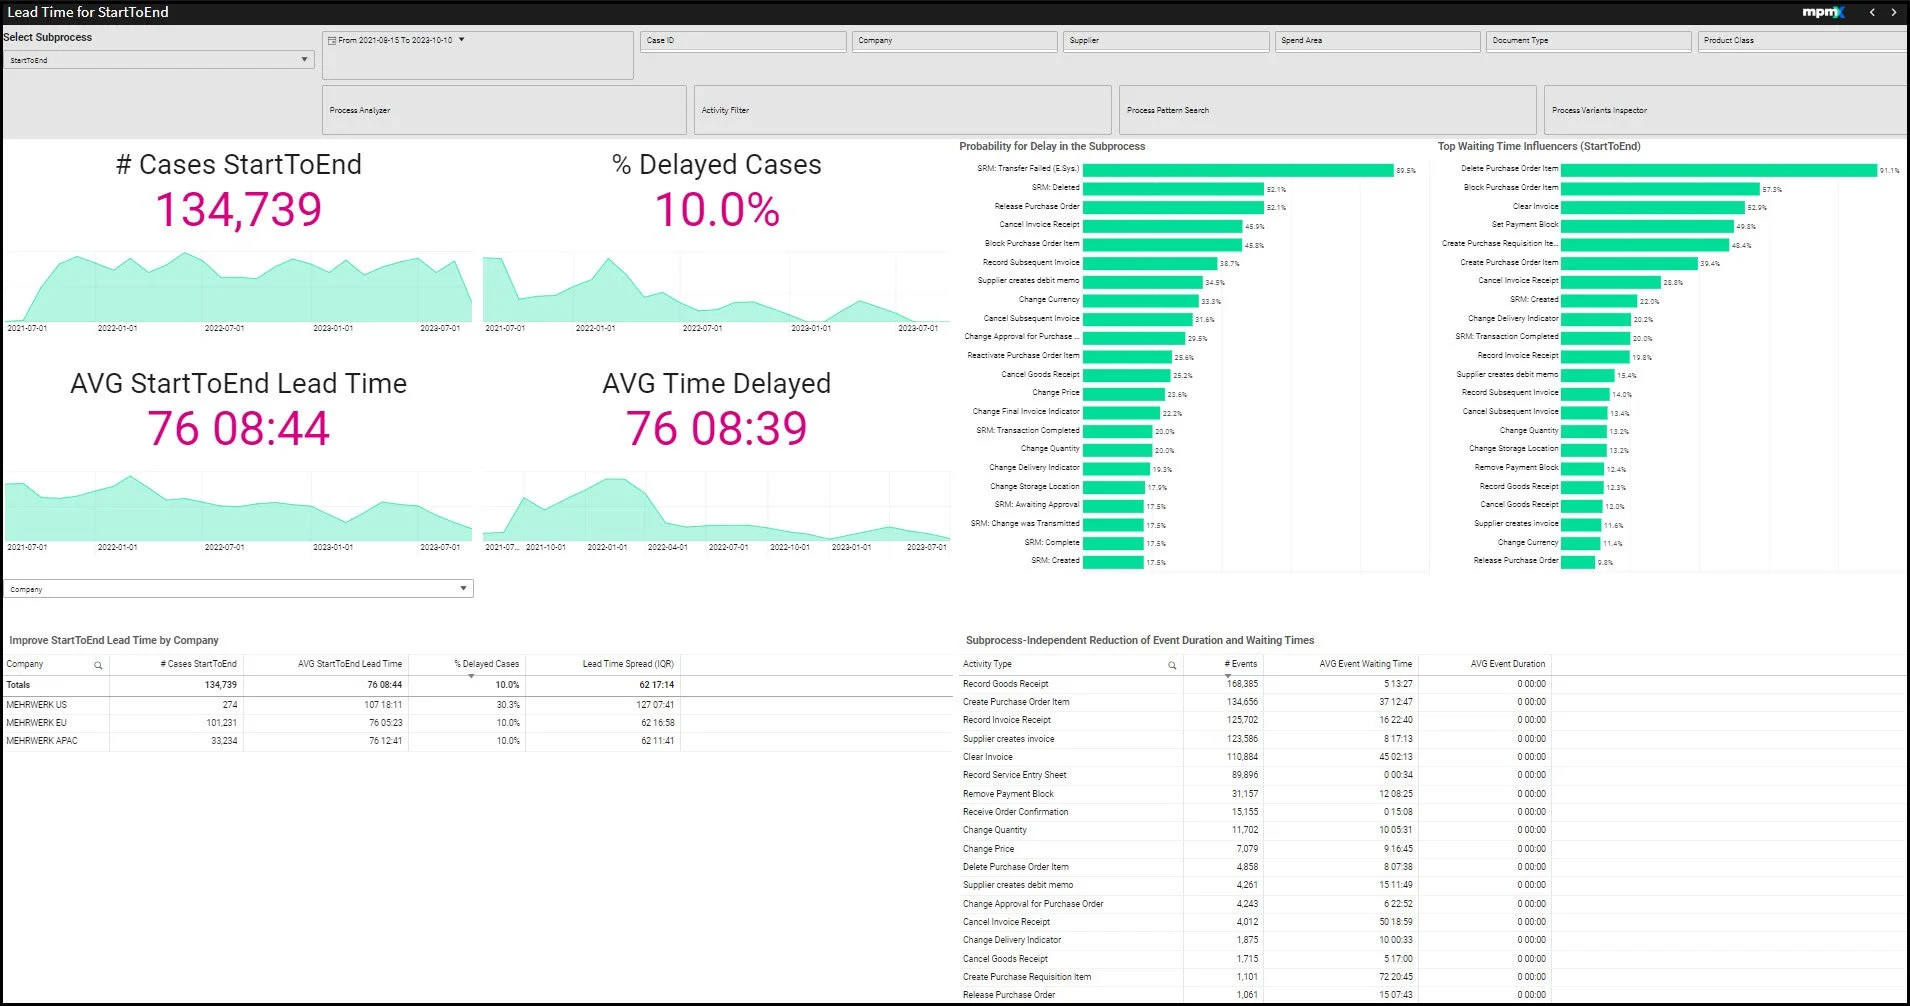
Lead Time
Functions
Do-it-yourself process analysis
A generic overview with basic PPIs, like number of cases and number of activities of the data analyzed in the application
Analyze the basic PPIs by process context, also as pivot in the Additional Analysis
Display of the process flow
Display of the event log in the Additional Analysis
Functions
Select/Analyze overall or subprocess lead times
Late cases and average or median late/overdue times are expressed, based on configuration of target lead times.
Analyze activities that contribute most to overdue cases
Analyze activities that contribute most to waiting times in overall process
Flexible analysis by any process context to identify lead time improvements
Looking Ahead: Find your Happy Path!
GINQO's future initiative involves integrating advanced process mining techniques and tools to further enhance analytic solution. Conversational AI can be leveraged to predict and address inefficiencies.
Business Benefits:
Quickly quantify process complexity and its necessity
Facilitate overall process flow
Reduce noncore process steps

Automation Sheet:
Expanding the Use Cases:
In a world where efficiency is paramount, GINQO’s data-centric approach to streamlining processes resonates even more.
This approach can be applied to many other complex processes such as: